SolutionsData & Analytics
Turn business
questions into
useful analysis.
Build AI agents that explore approved business data, compare performance and prepare charts, findings and reporting briefs. Connect the data and definitions they should use, and control how the results are shared.
Context for the numbers
Metric definitions and reporting scope made explicit.
Analysis your team can inspect
Charts, supporting figures and qualified findings.
Controlled access and sharing
Define what agents can retrieve and where reports can go.
02Workflows to explore
Put analysis to work
across your organization.
Build agents around the questions your teams need to answer. Start with a performance review, an investigation or a recurring briefing, then define the inputs and boundaries the work requires.
- Featured workflow
Business data analysis
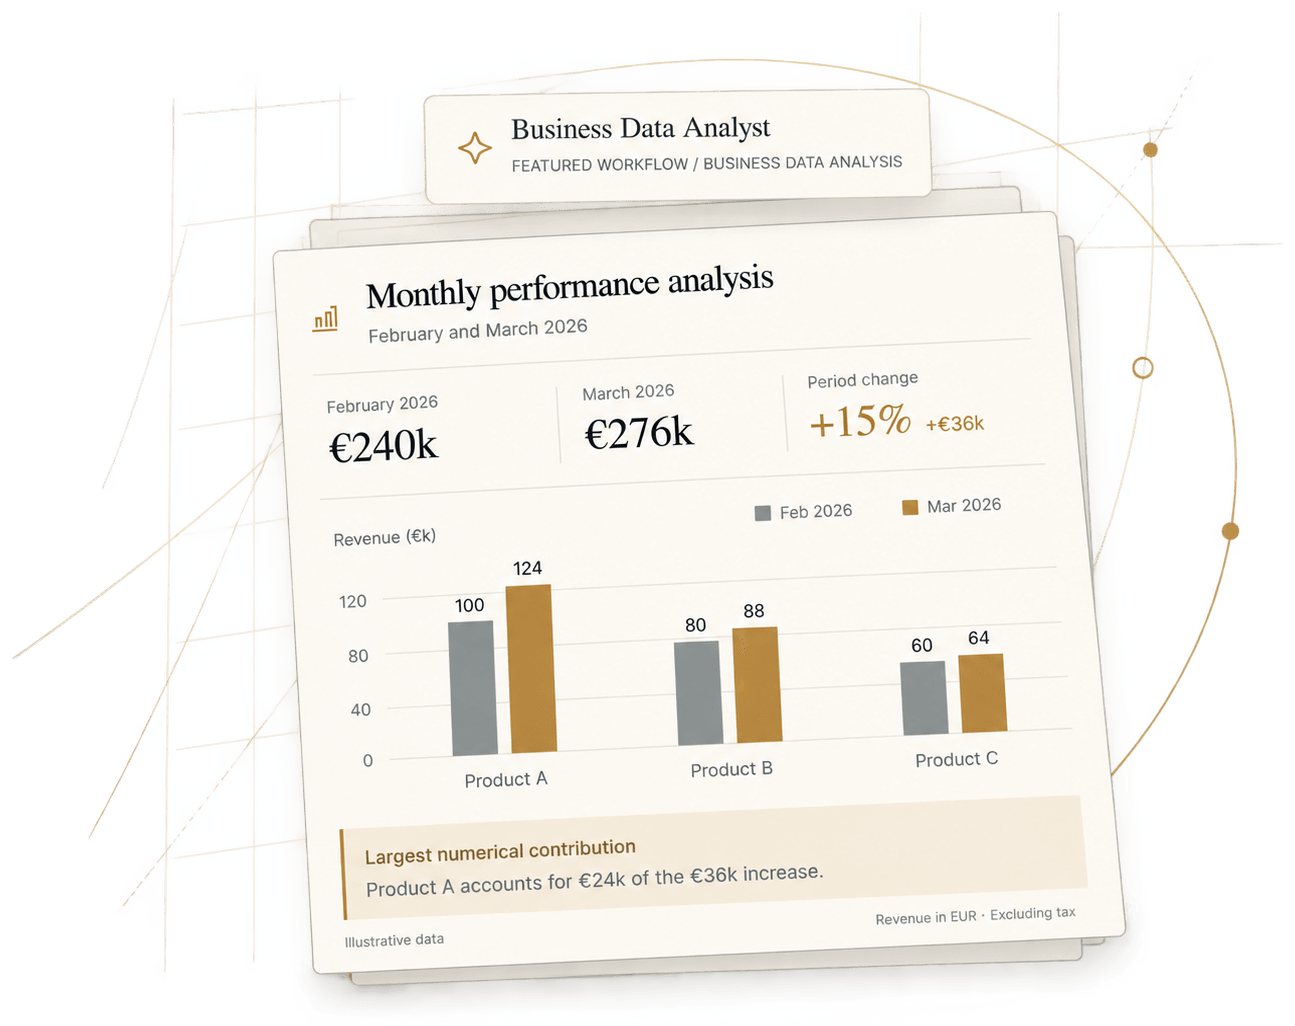
Compare reporting periods, break down changes and prepare an explanation supported by the figures.
Example output: Performance analysis with charts, figures and questions for further investigation.
See the worked example - Example to configure
Data-quality investigation
Review approved profiling results or data summaries. Investigate incomplete periods, inconsistent categories and conflicting definitions.
Example output: An issue brief with affected measures, evidence and questions for the data owner.
- Example to configure
Planning and what-if comparison
Compare defined scenarios using supplied assumptions, available business data and configured calculation rules.
Example output: A scenario comparison with its assumptions, calculations and limitations.
- Example to configure
Recurring management briefings
Prepare regular performance briefings using agreed metric definitions and reporting guidelines. Highlight changes worth reviewing.
Example output: A scheduled or system-triggered briefing with charts and notable changes.
Your workflow may be different. These are examples to configure around your data access, analytical procedures and reporting requirements. What-if comparisons are not forecasts.
03One workflow, in detail
Illustrative workflowFrom a business question
to an analysis your team can inspect.
Compare March with February. Break down the revenue change by product and region, then prepare a chart, supporting figures and a short briefing.
A static illustration. The panel is one picture of a fictional analysis over synthetic aggregate data; nothing here reads a live data store, and the figures are not a Zograph performance benchmark.
Establish the question
Check the metric definition, reporting periods and filters.
Analyze approved data
Retrieve permitted aggregates and compare products and regions.
Prepare the analysis
Create the chart, check the figures and qualify the findings.
Control external sharing
Request administrator approval before external distribution.
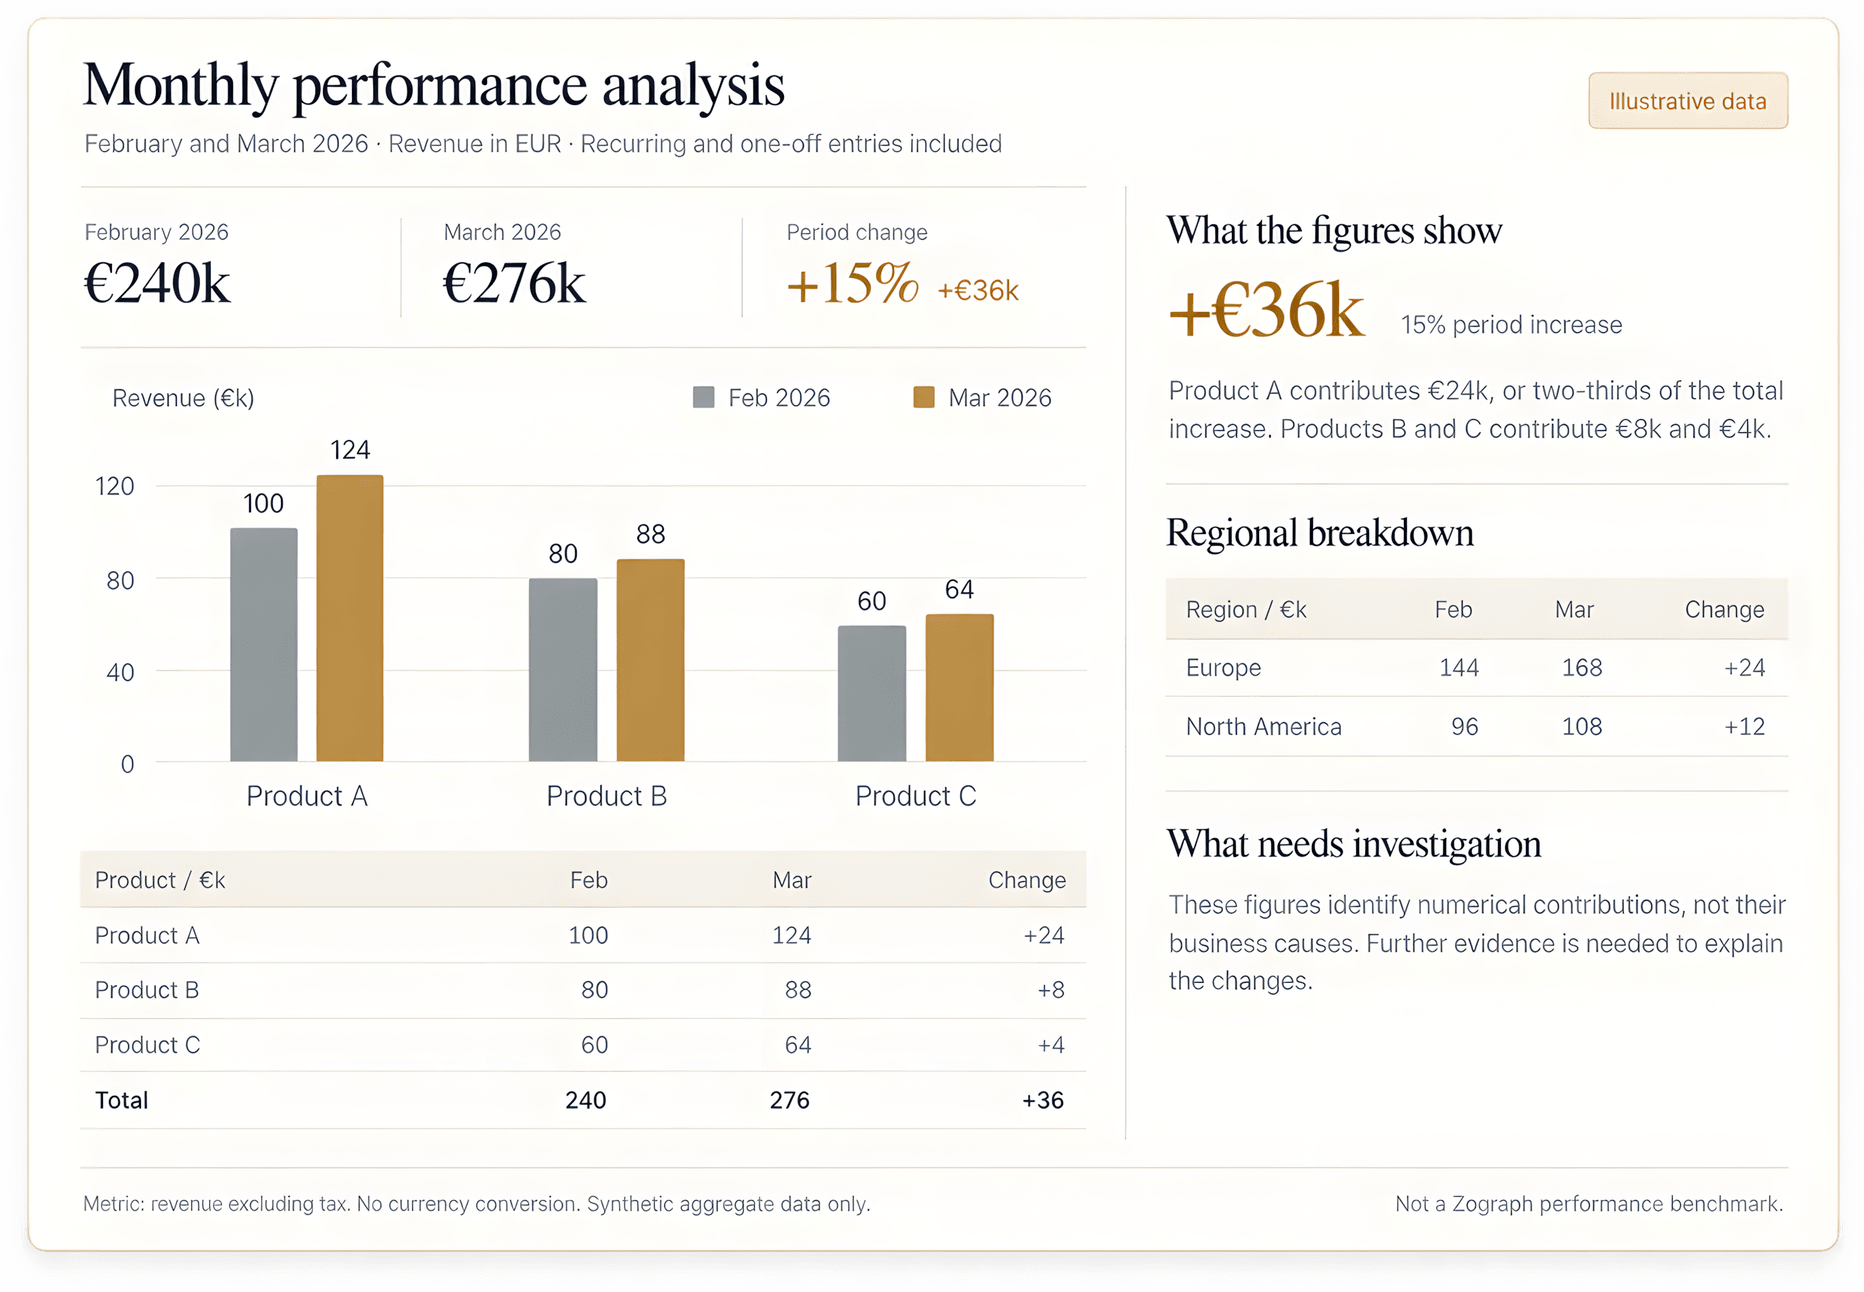
Continue the analysis: “Now exclude one-off transactions.”
In the same illustrative fixture, recurring revenue changes from €220k to €248k.
04Permissions and approvals
Explore within scope.
Share with the
right authority.
Define what an agent can retrieve, create and share. Keep data access, analytical preparation and external distribution as separate decisions.
Example policies for this workflow
| Action | Configured boundary |
|---|---|
| Read approved aggregate metrics | Allowed |
| Create the analysis artifact | Allowed |
| Revise the analysis artifact | Standing grant |
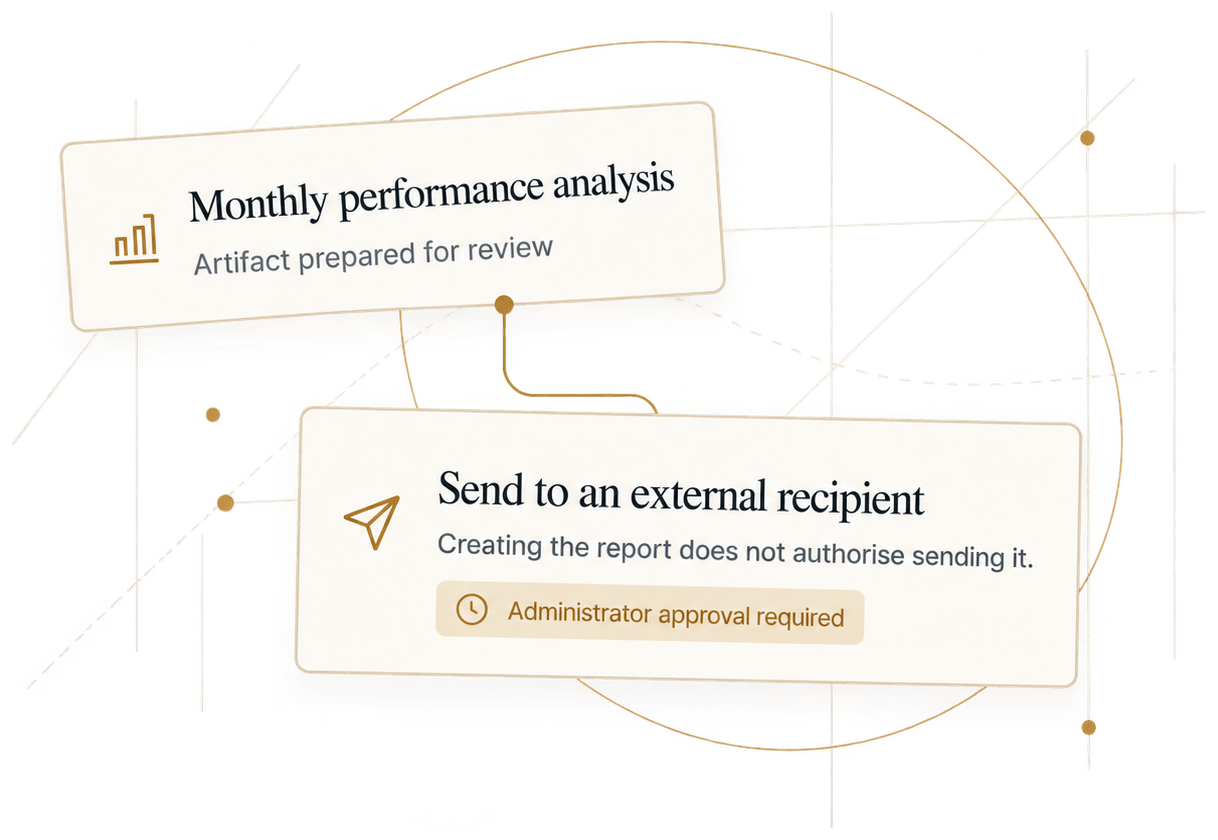
| Send the report to an external recipient | Administrator approval |
| Export restricted row-level records | Denied |
An analysis can be ready
while sharing stays pending.
The external distribution request waits for the required administrator decision.
This is a static illustration. No real report is sent and no approval is simulated.
These policies govern the configured tools and actions. They do not, by themselves, establish database row-level or column-level security.
05Analytical checks and the execution record
Check the analysis.
Inspect how it was produced.
Evaluate the output against defined analytical expectations. Inspect the recorded steps behind retrieval, calculation, artifact creation and the decision to share.
Example fixture checks
Calculated against the synthetic data shown on this page.
- Periods and filtersFebruary and March 2026; the same stated revenue scope.
- Aggregate calculations€240k → €276k. Change: +€36k, or +15%.
- Chart consistencyAll six bars match the product-level supporting figures.
- Supported findingsProduct A contributes €24k of the €36k increase.
- Metric definitionRevenue excluding tax, with recurring and one-off entries included.
Passing these fixture checks is not a guarantee that every generated analysis will be correct.
Recorded analysis run
Illustrative recordBusiness Data Analyst / Monthly performance analysis
- 10:14Metric definitions reviewedContext: metric definition and reporting scope.
- 10:15Approved aggregates retrievedAllowed through the configured analytics access.
- 10:16Period comparisons calculatedTotals, product and region changes calculated.
- 10:17Analysis artifact createdMonthly performance analysis recorded.
- 10:18External distribution requestedAdministrator approval required.
- PendingDistribution not executedThe request remains held. No external report sent.
Permission, approval and execution are different records.
See what was allowed, what is waiting and whether the connected action actually ran.
06Connected data and analytical context
Your data.
Your definitions.
Your reporting
requirements.
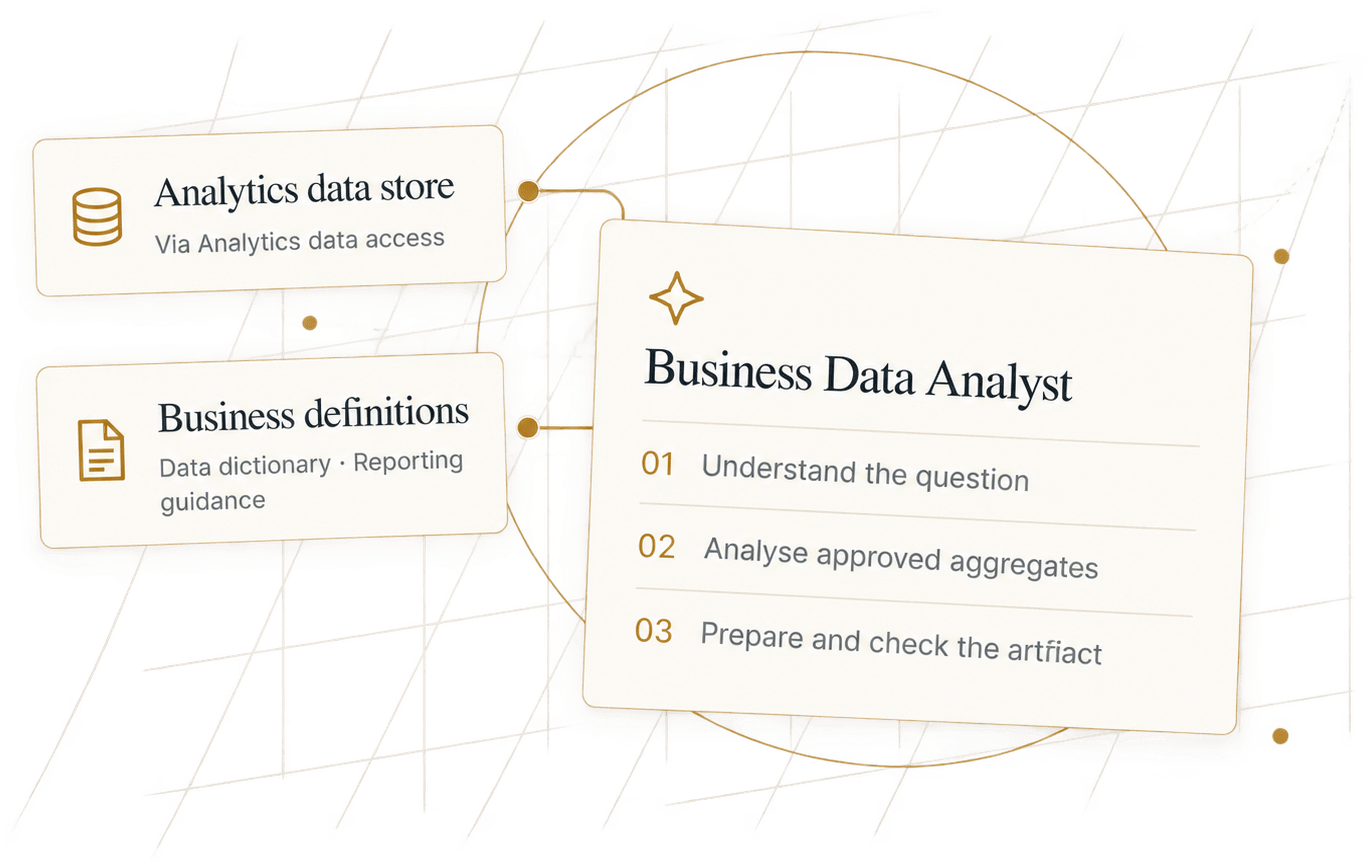
Connect scoped analytical tools and provide the context that gives the numbers their meaning.
Scoped analytical access
Expose the approved aggregates and analytical operations needed for the task, through configured tools.
Metric definitions and data context
Provide business definitions and a data dictionary. Make the meaning and scope of a measure explicit.
Reporting guidance
Define the supporting figures, presentation and qualifications the analysis should include.
- On demandAsk a question, inspect the analysis and refine the comparison.
- On a schedule or from your systemsConfigure a Performance change review to prepare a briefing with charts and notable changes.
Trigger types are alternatives. Available data and actions depend on your configured connections and permissions.

07Get started
Start with one
analytical workflow.
Bring a business question, a recurring review or a reporting task. We’ll explore the data and definitions an agent needs, the output your team can use and the controls around access and sharing.
Clearer questions.
Useful analysis.
Defined boundaries.